Chapter 28: Tools and Workflow
Taos includes several tools and conventions for development, testing, and debugging.
28.1 The Sample Framework#
Self-contained samples in samples/ demonstrate individual features in isolation. Each sample has an HTML file and a TypeScript entry point:
samples/
├── forward_test.html
├── forward_tes.ts              — Forward renderer demo
├── crafty_animal_viewer.html
├── crafty_animal_viewer.ts     — Test animal NPCs
├── cascade_shadow_test.html
└── cascade_shadow_test.ts      — CSM visualization
Samples share no state with each other or with the main game. Each creates its own RenderContext and PhysicalResourceCache, constructs the persistent pass instances it needs, and on each frame builds a fresh RenderGraph from those instances. This makes them ideal for testing specific features in isolation.
To add a new sample, create two files. A typescript file:
// samples/my_feature.ts — minimal new-sample skeleton
import { RenderContext } from '../../src/renderer/index.js';
import { RenderGraph, PhysicalResourceCache } from '../../src/renderer/render_graph/index.js';

async function main() {
  const canvas = document.getElementById('canvas') as HTMLCanvasElement;
  const ctx = await RenderContext.create(canvas);
  const cache = new PhysicalResourceCache(ctx.device);

  // Build persistent pass instances once.
  // const myPass = MyPass.create(ctx);

  function frame() {
    const graph = new RenderGraph(ctx, cache);
    const backbuffer = graph.setBackbuffer('canvas');
    // myPass.addToGraph(graph, { ..., backbuffer });
    const compiled = graph.compile();
    void graph.execute(compiled);
    requestAnimationFrame(frame);
  }
  requestAnimationFrame(frame);
}

main();
With an associated html:
<!DOCTYPE html>
<html lang="en">
<head>
  <meta charset="UTF-8">
  <meta name="viewport" content="width=device-width, initial-scale=1.0">
  <title>Test My Feature</title>
  <link rel="icon" href="../favicon.svg" type="image/svg+xml">
</head>
<body>
  <canvas id="canvas"></canvas>
  <script type="module" src="./my_feature.ts"></script>
</body>
</html>
28.2 Testing Strategy#
Taos uses Vitest for unit testing. Tests live in tests/ and cover mathematical correctness, data structure invariants, and component behavior:
// ── from tests/math/vec3.test.ts ──
describe('cross', () => {
  it('should compute cross product', () => {
    const v1 = new Vec3(1, 0, 0);
    const v2 = new Vec3(0, 1, 0);
    const result = v1.cross(v2);
    expect(result.x).toBe(0);
    expect(result.y).toBe(0);
    expect(result.z).toBe(1);
  });

  it('should be anti-commutative', () => {
    const v1 = new Vec3(1, 2, 3);
    const v2 = new Vec3(4, 5, 6);
    const c1 = v1.cross(v2);
    const c2 = v2.cross(v1);
    expect(c1.x).toBe(-c2.x);
    expect(c1.y).toBe(-c2.y);
    expect(c1.z).toBe(-c2.z);
  });
});
Tests are run with:
| Command | Purpose |
|---|---|
npm test |
Watch mode (re-run on change) |
npm run test:run |
Single run (CI) |
npm run test:coverage |
Single run with coverage report |
WebGPU-dependent features cannot be tested in Node.js. Those are tested via sample pages and visual inspection.
28.3 Debugging WebGPU#
Validation Errors#
WebGPU validation errors are the primary debugging tool. With enableErrorHandling: true, Taos wraps each pass in error scopes:
// ── from crafty/main.ts (frame loop) ──
ctx.pushPassErrorScope('frame');
// ... build the graph, compile, execute ...
await ctx.popPassErrorScope('frame');
pushPassErrorScope pushes the three scope types WebGPU exposes (validation, out-of-memory, internal); popPassErrorScope awaits all three and prints the first non-null one with the label, so an error inside the frame is always tied to a named scope rather than a global unhandledrejection.
Shader Debugging#
WGSL compilation errors are reported through getCompilationInfo():
// Illustrative — drop-in helper around the standard WebGPU API:
const info = await shaderModule.getCompilationInfo();
for (const msg of info.messages) {
if (msg.type === 'error') {
console.error(`${msg.lineNum}:${msg.linePos}: ${msg.message}`);
// ... show the surrounding source line for context ...
}
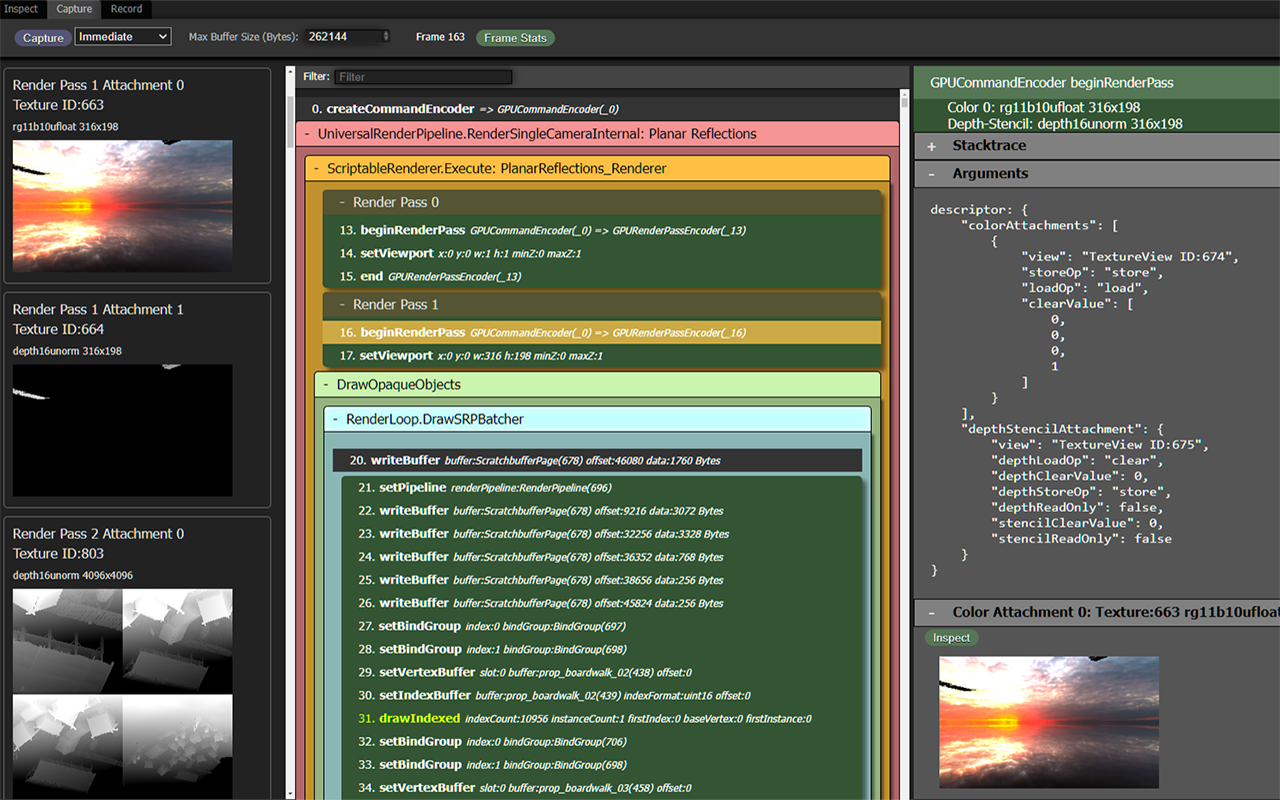
}WebGPU Inspector (Chrome Extension)#
The WebGPU Inspector is a Chrome extension that provides GPU debugging capabilities. Its source is at https://github.com/brendan-duncan/webgpu_inspector. It shows:
- Active pipelines, bind groups, and resources.
- Texture and buffer contents (viewable as images/hex).
- GPU command traces.
- Validation error messages with backtraces.
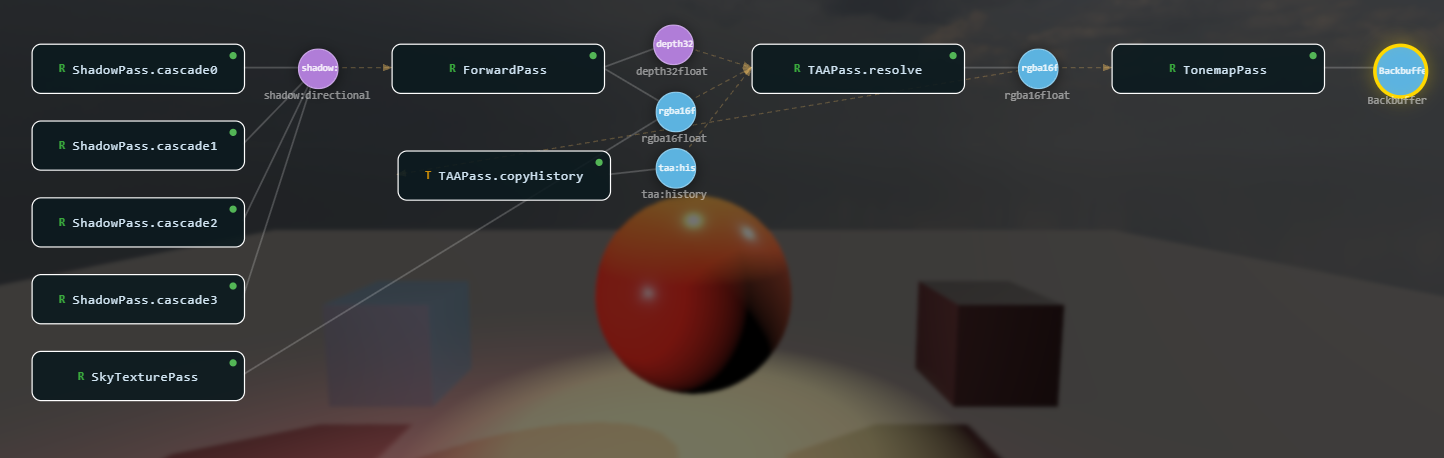
Render Graph Visualizer#
General-purpose tools like the WebGPU Inspector are invaluable, but they don't know anything about your abstractions. Once a codebase grows a non-trivial structure of its own — the render graph being the obvious example — it's often worth writing a small custom tool that speaks that abstraction's language directly. A built-in debug overlay that shows passes and virtual resources as you actually think about them is usually a few hundred lines of vanilla DOM and pays for itself the first time you have to chase a culled pass or a misrouted texture.
Taos ships one such tool: the Render Graph Viz at src/renderer/render_graph/ui/render_graph_viz.ts. It renders the compiled graph as a node-and-edge diagram — passes as labeled boxes, virtual textures and buffers as circles/squares, write edges in white, read edges in dashed amber — with the layout derived from the pass topological levels.
Wiring it into a sample or the main game is one call:
// ── from samples/rg_deferred_simple.ts ──
import { createRenderGraphViz } from '../src/renderer/render_graph/ui/render_graph_viz.js';

const graphViz = createRenderGraphViz(null).attach();   // adds the G hotkey

engine.afterFrame(() => {
  if (engine.currentGraph && engine.currentCompiled) {
    graphViz.setGraph(engine.currentGraph, engine.currentCompiled);  // snapshot for the overlay
  }
});
What it gives you:
- Press G to toggle the overlay. Pan with drag, zoom with scroll, drag individual nodes, press A to frame all.
- Hover a pass or texture to highlight its inputs (blue) and outputs (amber), with a tooltip listing format, resolution, producers, and consumers.
- Culled passes (passes that don't reach the backbuffer) show with a red border and tag, so removed work is obvious.
- Right-click a texture node → "Show Texture" does a GPU readback (
textureLoadblit into an RGBA8 target, thencopyTextureToBuffer+mapAsync) and displays the result in a draggable panel. HDR formats are Reinhard-tonemapped; depth formats are visualized aspow(d, 8)grayscale. The canvas backbuffer is skipped because its texture is only valid duringexecute().
The viz is intentionally framework-free — no React, no canvas library, just SVG + absolute-positioned divs built from the graph snapshot. That kind of "small custom tool for one specific abstraction" is worth reaching for whenever a system gets complex enough that generic tooling stops answering the questions you actually have.
28.4 Asset Pipeline#

Texture Atlas Building#
Crafty's block textures come from the Vanilla-RTX texture pack — a PBR pack that ships an albedo, normal, and MER (metallic / emission / roughness) map for every block. scripts/build_atlas.js packs that pack into the texture atlases the chunk renderer samples.
Run with no arguments, it sparse-clones the Vanilla-RTX-Normals variant from GitHub into scripts/.cache/ (using git sparse-checkout, so only the one variant is fetched) and uses that. Pass a path to use a local texture pack instead:
npm run build-atlas                          # download + use Vanilla-RTX-Normals
npm run build-atlas path/to/texture/pack     # use a local pack
It requires the sharp image library (npm install sharp). For each block texture it loads the .tga albedo, MER, and normal (or heightmap) tiles, resizes them to a 16×16 tile with nearest-neighbor scaling, and packs them into a 25-column grid. It writes six files into assets/generated_atlas/:
| File | Contents |
|---|---|
color_atlas.png |
Packed albedo tiles |
normal_atlas.png |
Packed tangent-space normal maps |
mer_atlas.png |
Packed metallic / emission / roughness maps |
heightmap_atlas.png |
Packed heightmaps (mid-gray where the pack ships none) |
atlas_data.json |
Flat per-tile listing: texture name → (x, y) grid cell |
blocks.json |
Per-block face manifest (see below) |
Grouping Tiles Into Blocks#
A texture pack is a flat list of tiles — cactus_top, cactus_side, cactus_bottom, dirt, … — and scripts/group_blocks.js folds those into per-block entries. A tile whose name ends in a recognized face suffix (_top, _bottom, _side, _north, …) is merged into a block keyed by the stem; a tile with no suffixed siblings becomes a single-tile block with an all face. The result is blocks.json:
{
  "atlasWidth": 400, "atlasHeight": 688, "tileSize": 16,
  "blocks": {
    "acacia_shelf":   { "all":  { "x": 0, "y": 0 } },
    "ancient_debris": { "side": { "x": 4, "y": 0 }, "top": { "x": 5, "y": 0 } }
  }
}
group_blocks.js runs automatically at the end of build_atlas.js, but is also runnable standalone (node scripts/group_blocks.js) to regenerate blocks.json from an existing atlas_data.json without re-packing the PNGs. Tiles the suffix heuristic mis-groups can be corrected in scripts/block_overrides.json, a face map merged on top of the auto-grouped result.
Generating Block Types#
scripts/codegen_blocks.js turns the manifest into TypeScript. It merges blocks.json with scripts/block_metadata.json — the hand-authored source of truth for engine-special blocks (fixed enum IDs and explicit material / hardness / light / tint) — and emits src/block/block_type_data.ts: the BlockType enum, the per-block data tables, and BLOCK_TYPE_COUNT.
Material type and hardness for the non-special blocks are guessed by a name heuristic (flower_* and *_sapling → prop, *_leaves and glass* → semi-transparent, …); anything it gets wrong is corrected per-block in block_metadata.json. The codegen also patches shared/net_protocol.ts's BLOCK_TYPE_MAX so the multiplayer server accepts edits for newly-added block types.
node scripts/codegen_blocks.js # after editing block_metadata.json or rebuilding the atlasThe full pipeline, then, is: texture pack → build_atlas.js → atlases + blocks.json → codegen_blocks.js → block_type_data.ts. Chapter 17 covers how the runtime consumes the result.
28.5 Continuous Integration#
The project uses GitHub Actions for CI. The workflow:
- Checkout and install Node.js.
- Install dependencies with
npm ci. - Type-check with
npx tsc --noEmit. - Lint with
npx eslint src/. - Run tests with
npm run test:run. - Build with
npm run build.
The CI pipeline does not run visual tests (no WebGPU in CI environments). Visual regression testing is done manually through the sample framework.
28.6 Summary#
The tooling and workflow infrastructure includes:
- Sample framework: Self-contained demos for isolated feature testing
- Testing strategy: Vitest for unit tests, sample pages for visual regression
- Debugging: WebGPU validation errors with per-pass error scopes, WGSL compilation info, Chrome extension
- Asset pipeline: RTX texture-pack atlas building, tile grouping, and block-type code generation
- CI pipeline: GitHub Actions with type-check, lint, test, and build stages
Further reading:
tests/— Unit test directoryscripts/build_atlas.js— Packs a Vanilla-RTX texture pack into the block atlasesscripts/group_blocks.js— Folds atlas tiles into a per-block face manifest (blocks.json)scripts/codegen_blocks.js— Generatessrc/block/block_type_data.tsfrom the manifest + metadatascripts/block_metadata.json— Engine-special block definitions and codegen heuristicssamples/— Self-contained demos